1
2
3
4
5
6
7
8
9
10
11
12
13
14
15
16
17
18
19
20
21
22
23
24
25
26
27
28
29
30
31
32
33
34
35
36
37
38
39
40
41
42
43
44
45
| clc
clear
close all
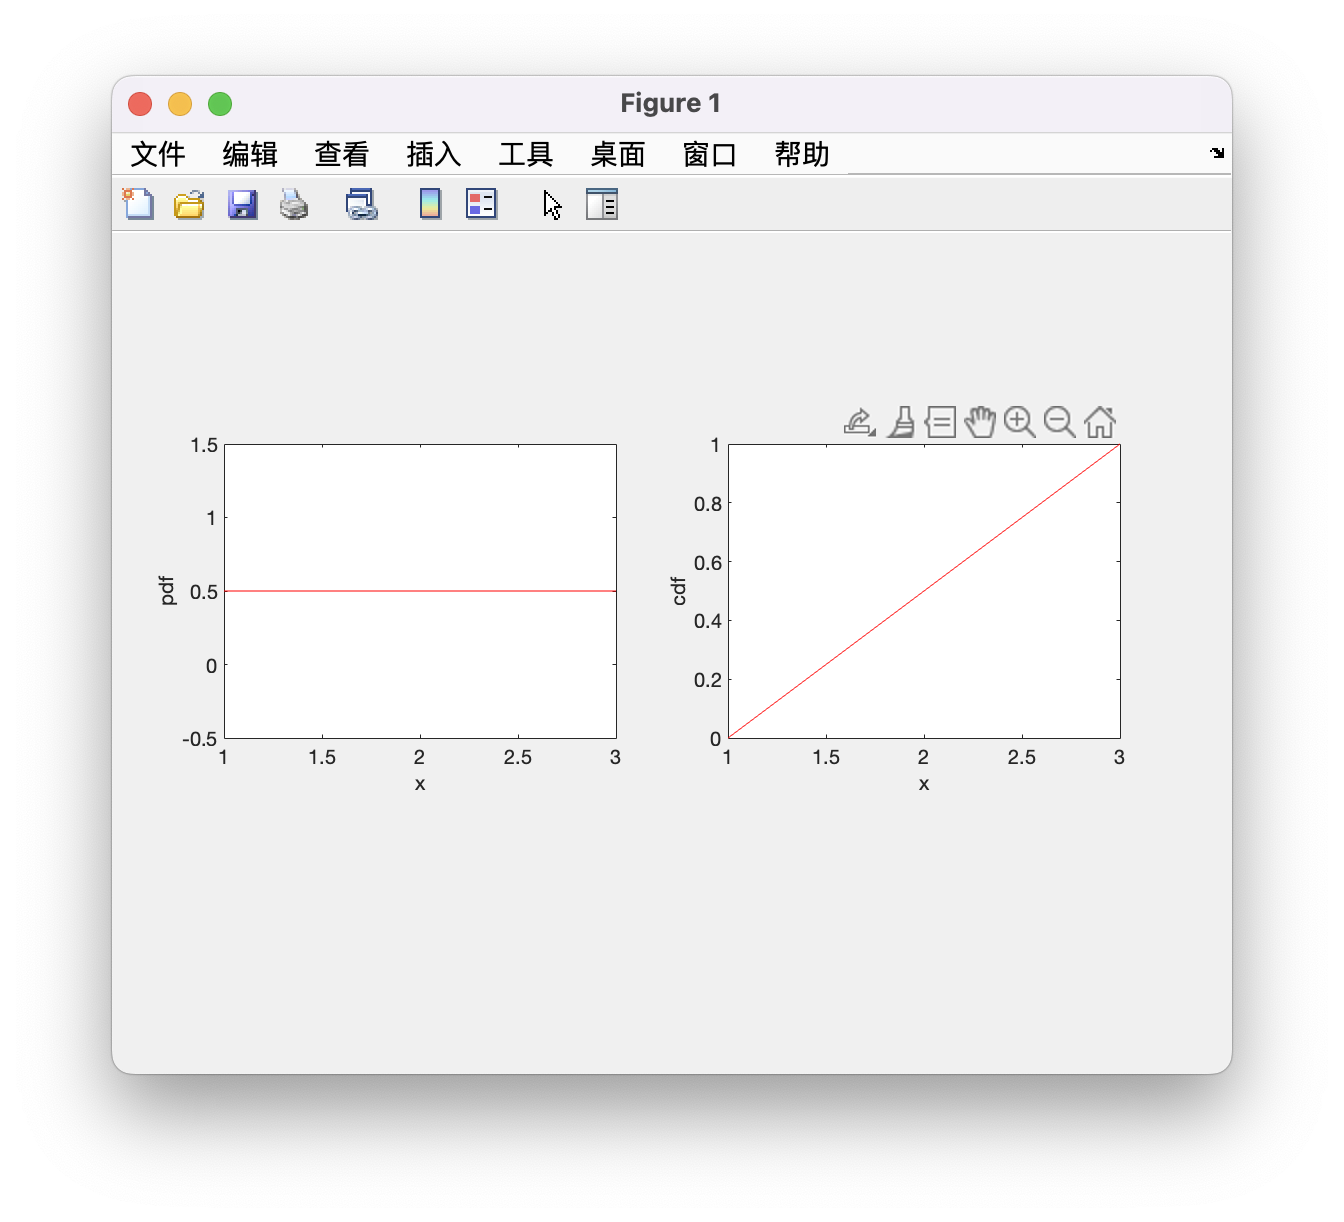
a=1;
b=3;
x=1:0.1:3;
for i=1:length(x)
fx(i)=1/(b-a);
Fx(i)=(x(i)-a)/(b-a);
end
h1=figure(1);
ax1=axes('Parent',h1,'Position',[0.1,0.4,0.35,0.35],'FontSize',10);
plot(x,fx,'r-')
xlabel('x','fontsize',10)
ylabel('pdf','FontSize',10)
ax2=axes('Parent',h1,'Position',[0.55,0.4,0.35,0.35],'FontSize',10);
plot(x,Fx,'r-')
xlabel('x','fontsize',10)
ylabel('cdf','FontSize',10)
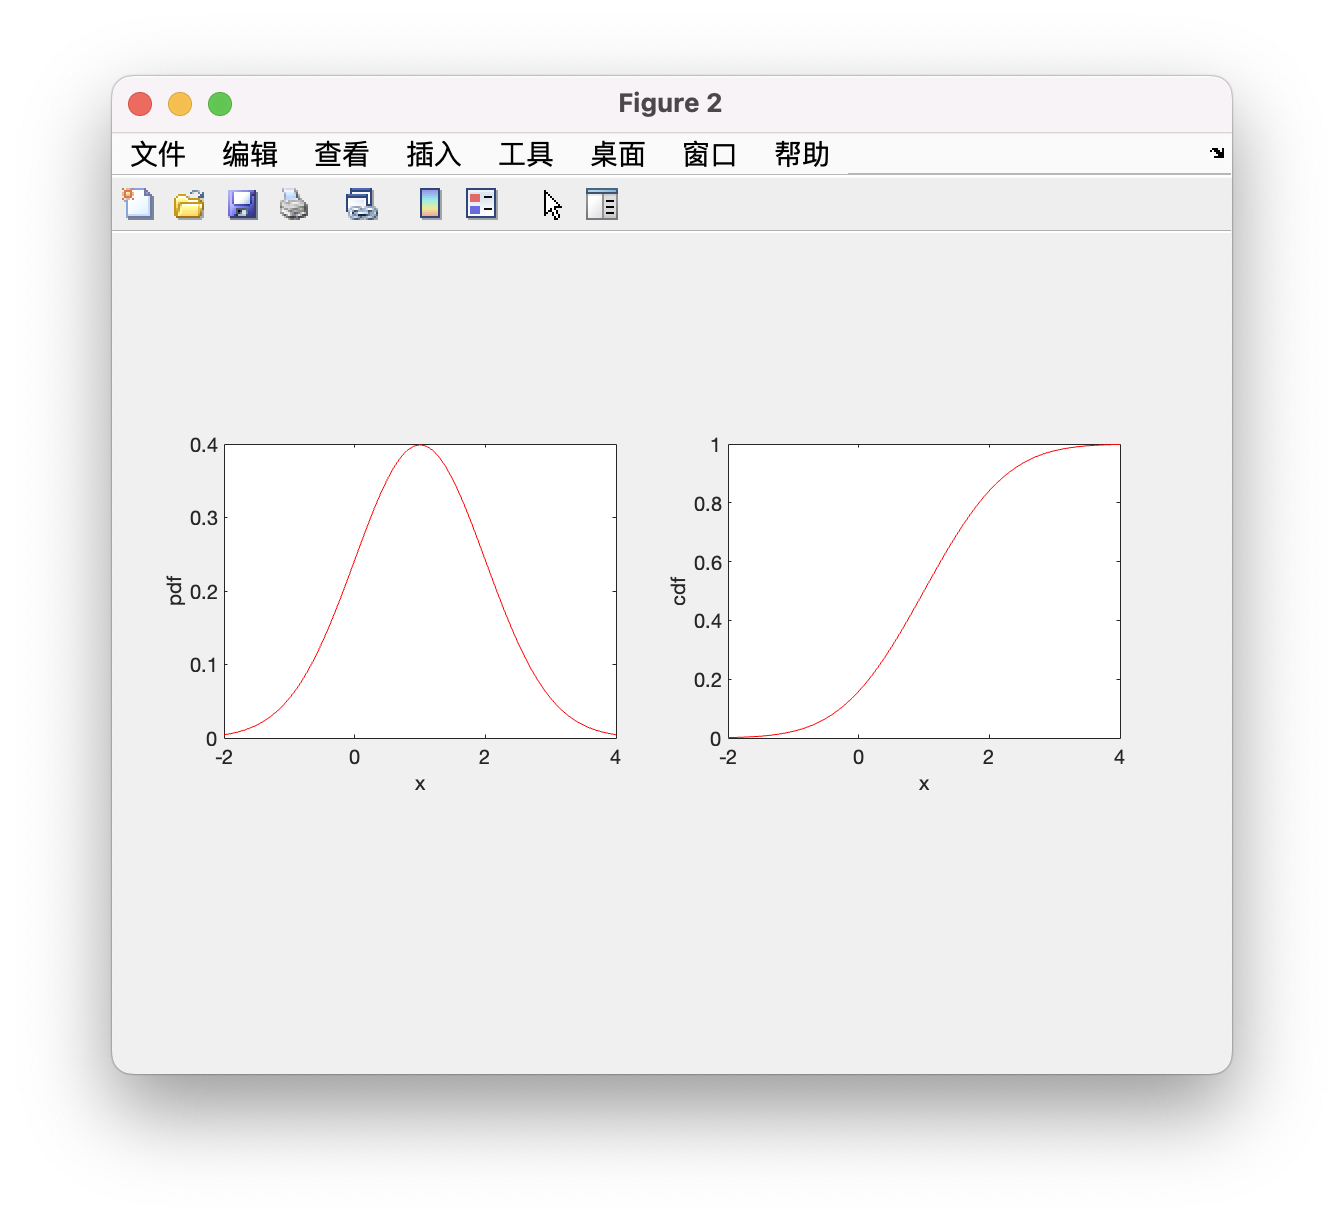
mux=1;sigx=1;
x=-2:0.1:4;
syms t
for i=1:length(x)
tx=x(i);
a1=1/(sigx*(2*pi)^0.5);
b1=exp(-0.5*((tx-mux)/sigx)^2);
fx(i)=a1*b1;
c1=int(exp(-0.5*((t-mux)/sigx)^2),t,-inf,tx);
Fx(i)=a1*c1;
end
h1=figure(2);
ax1=axes('Parent',h1,'Position',[0.1,0.4,0.35,0.35],'FontSize',10);
plot(x,fx,'r-')
xlabel('x','fontsize',10)
ylabel('pdf','FontSize',10)
ax2=axes("Parent",h1,"Position",[0.55,0.4,0.35,0.35],"FontSize",10);
plot(x,Fx,'r-')
xlabel('x','fontsize',10)
ylabel('cdf','FontSize',10)
|