本文将记录《结构可靠度理论》的一些代码及课堂笔记,采用Matlab编程
1 概率分布密度(pdf、cdf)
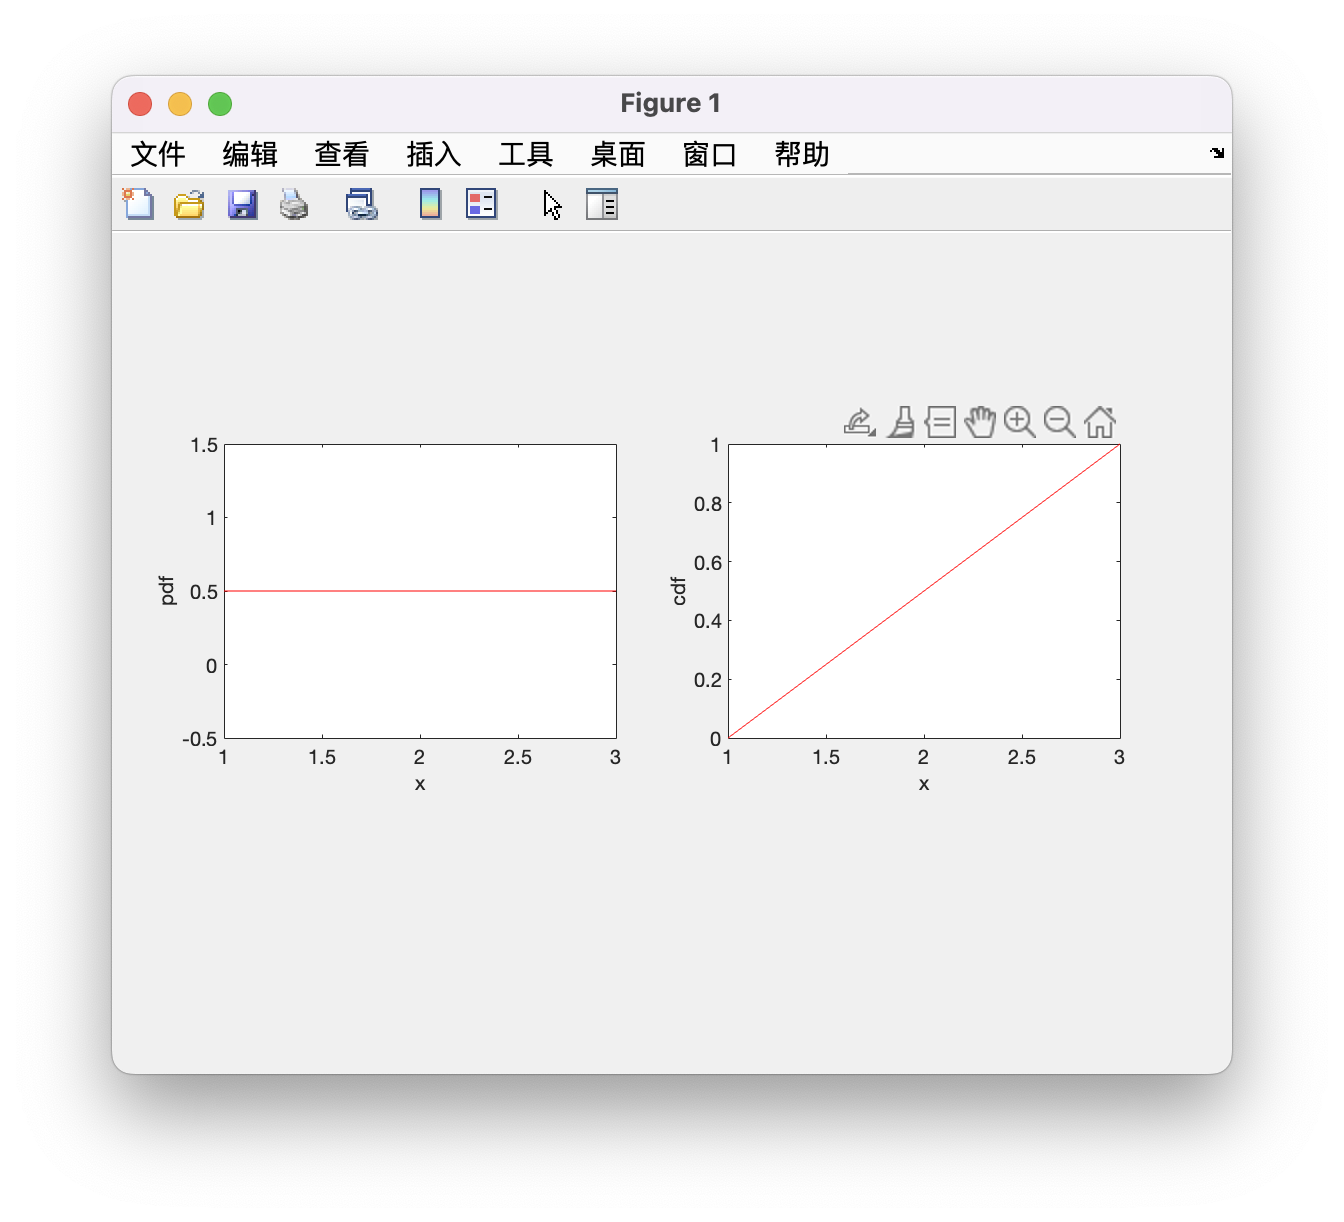
自己编写函数
clc
clear
close all
% unif
a=1;
b=3;
x=1:0.1:3;
for i=1:length(x)
    fx(i)=1/(b-a);
    Fx(i)=(x(i)-a)/(b-a);
end
h1=figure(1);
ax1=axes('Parent',h1,'Position',[0.1,0.4,0.35,0.35],'FontSize',10);
plot(x,fx,'r-')
xlabel('x','fontsize',10)
ylabel('pdf','FontSize',10)

ax2=axes('Parent',h1,'Position',[0.55,0.4,0.35,0.35],'FontSize',10);
plot(x,Fx,'r-')
xlabel('x','fontsize',10)
ylabel('cdf','FontSize',10)

%-------
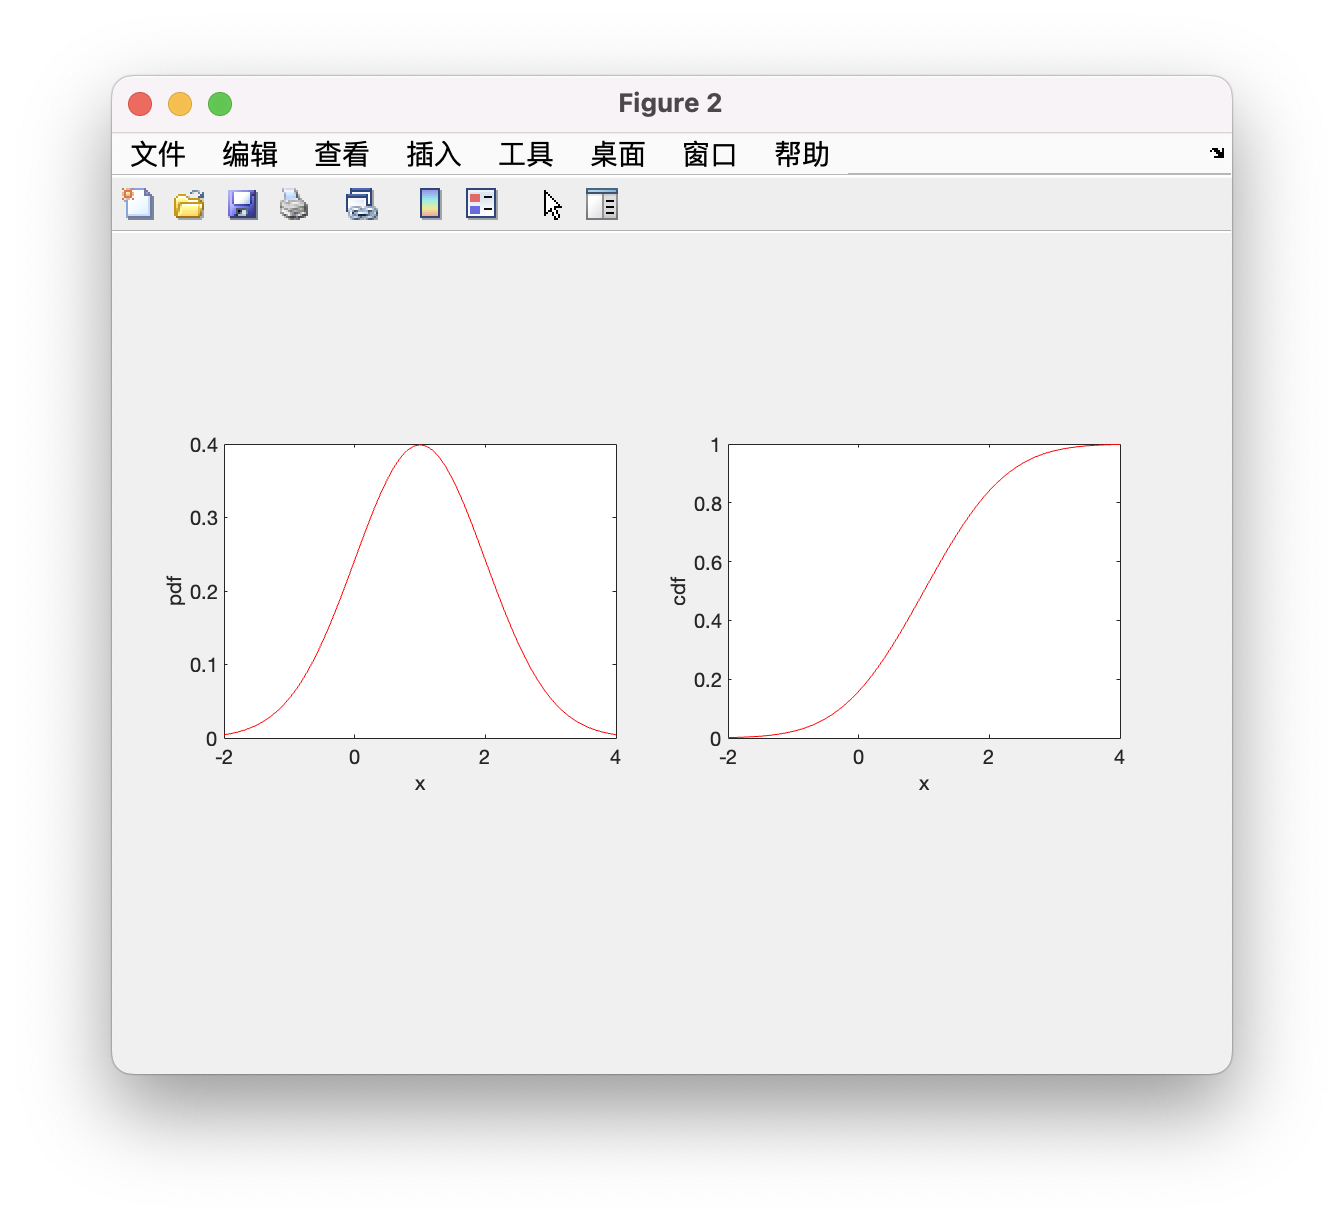
mux=1;sigx=1;
x=-2:0.1:4;
syms t
for i=1:length(x)
    tx=x(i);
    a1=1/(sigx*(2*pi)^0.5);
    b1=exp(-0.5*((tx-mux)/sigx)^2);
    fx(i)=a1*b1;
    c1=int(exp(-0.5*((t-mux)/sigx)^2),t,-inf,tx);
    Fx(i)=a1*c1;
end

h1=figure(2);
ax1=axes('Parent',h1,'Position',[0.1,0.4,0.35,0.35],'FontSize',10);
plot(x,fx,'r-')
xlabel('x','fontsize',10)
ylabel('pdf','FontSize',10)

ax2=axes("Parent",h1,"Position",[0.55,0.4,0.35,0.35],"FontSize",10);
plot(x,Fx,'r-')
xlabel('x','fontsize',10)
ylabel('cdf','FontSize',10)
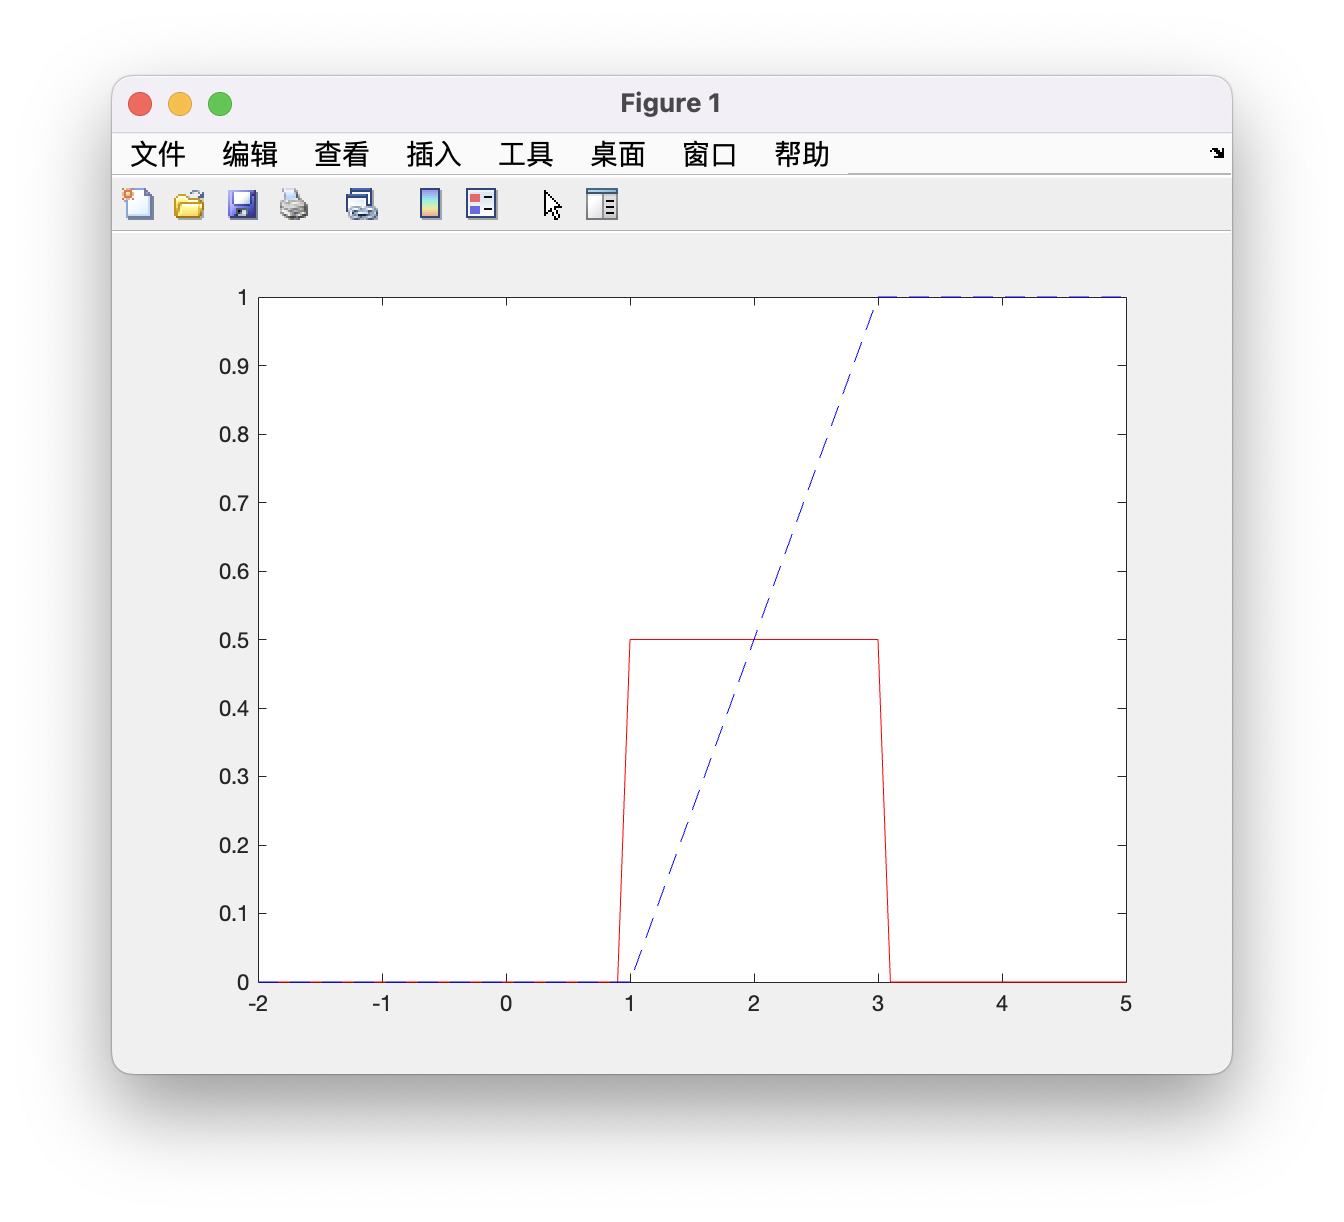
调用Matlab自带函数
clc
clear
close all
%-----
a=1;b=3;
x=-2:0.1:5;
fx=unifpdf(x,a,b);
Fx=unifcdf(x,a,b);
figure(1)
plot(x,fx,'-r')
hold on
plot(x,Fx,'--b')

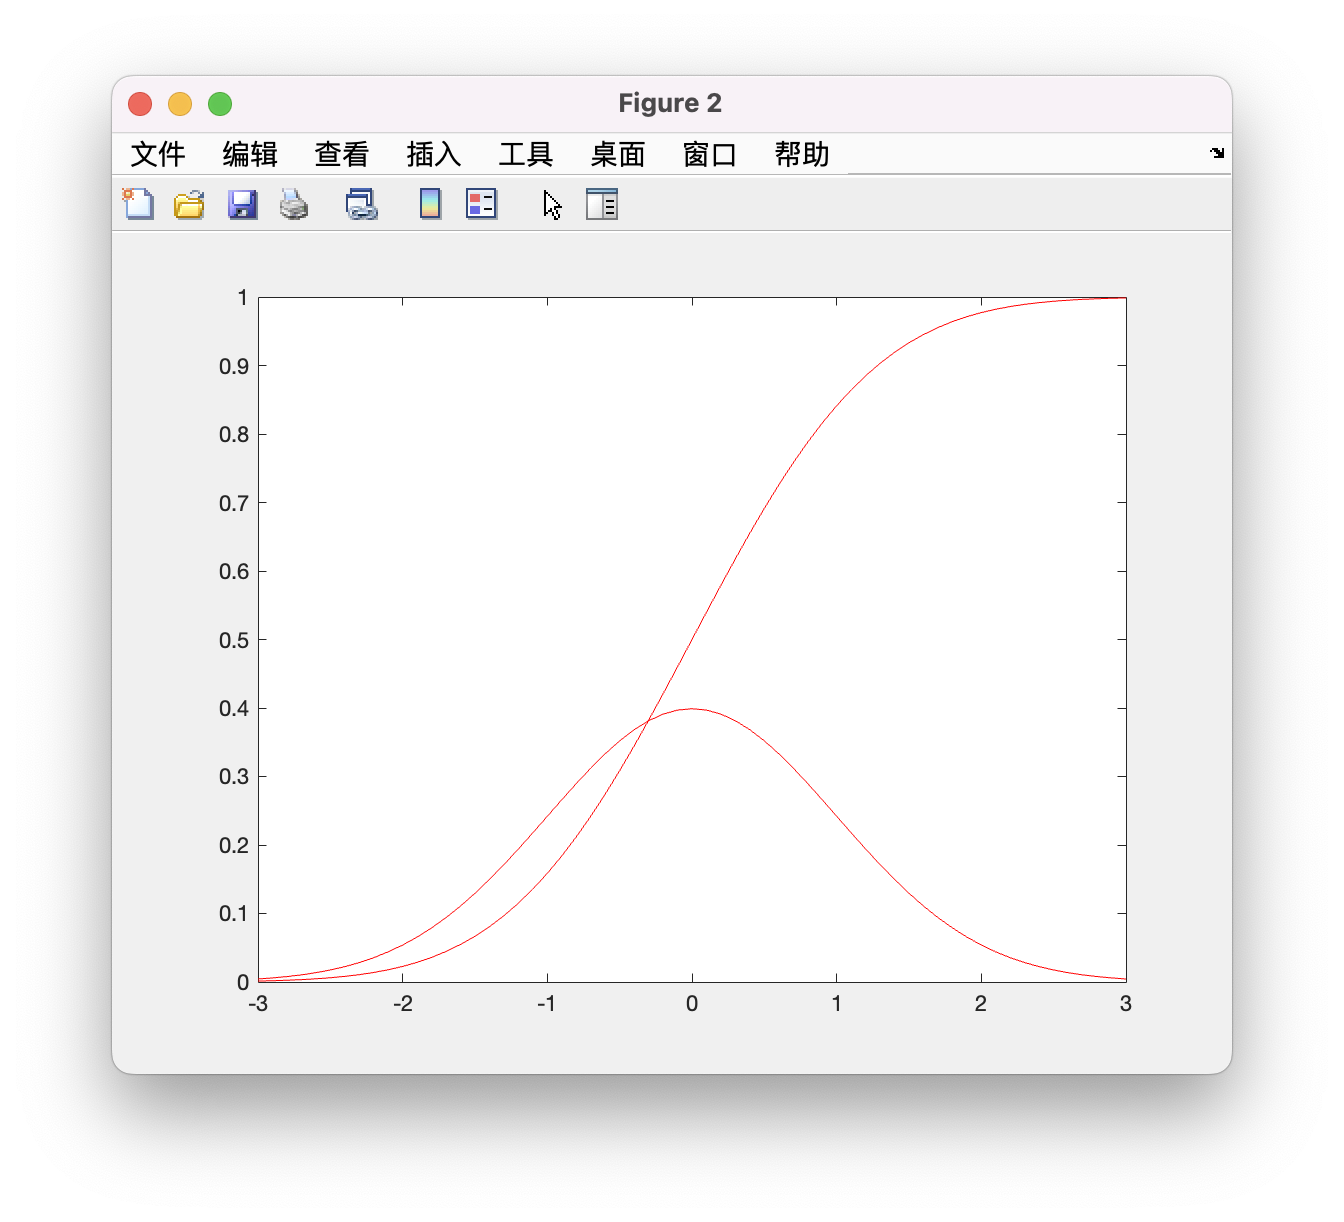
%---------
mux=0;sigx=1;
x=-3:0.1:3;
fx=normpdf(x,mux,sigx);
Fx=normcdf(x,mux,sigx);

figure(2)
plot(x,fx,'r-')
hold on
plot(x,Fx,'r-')
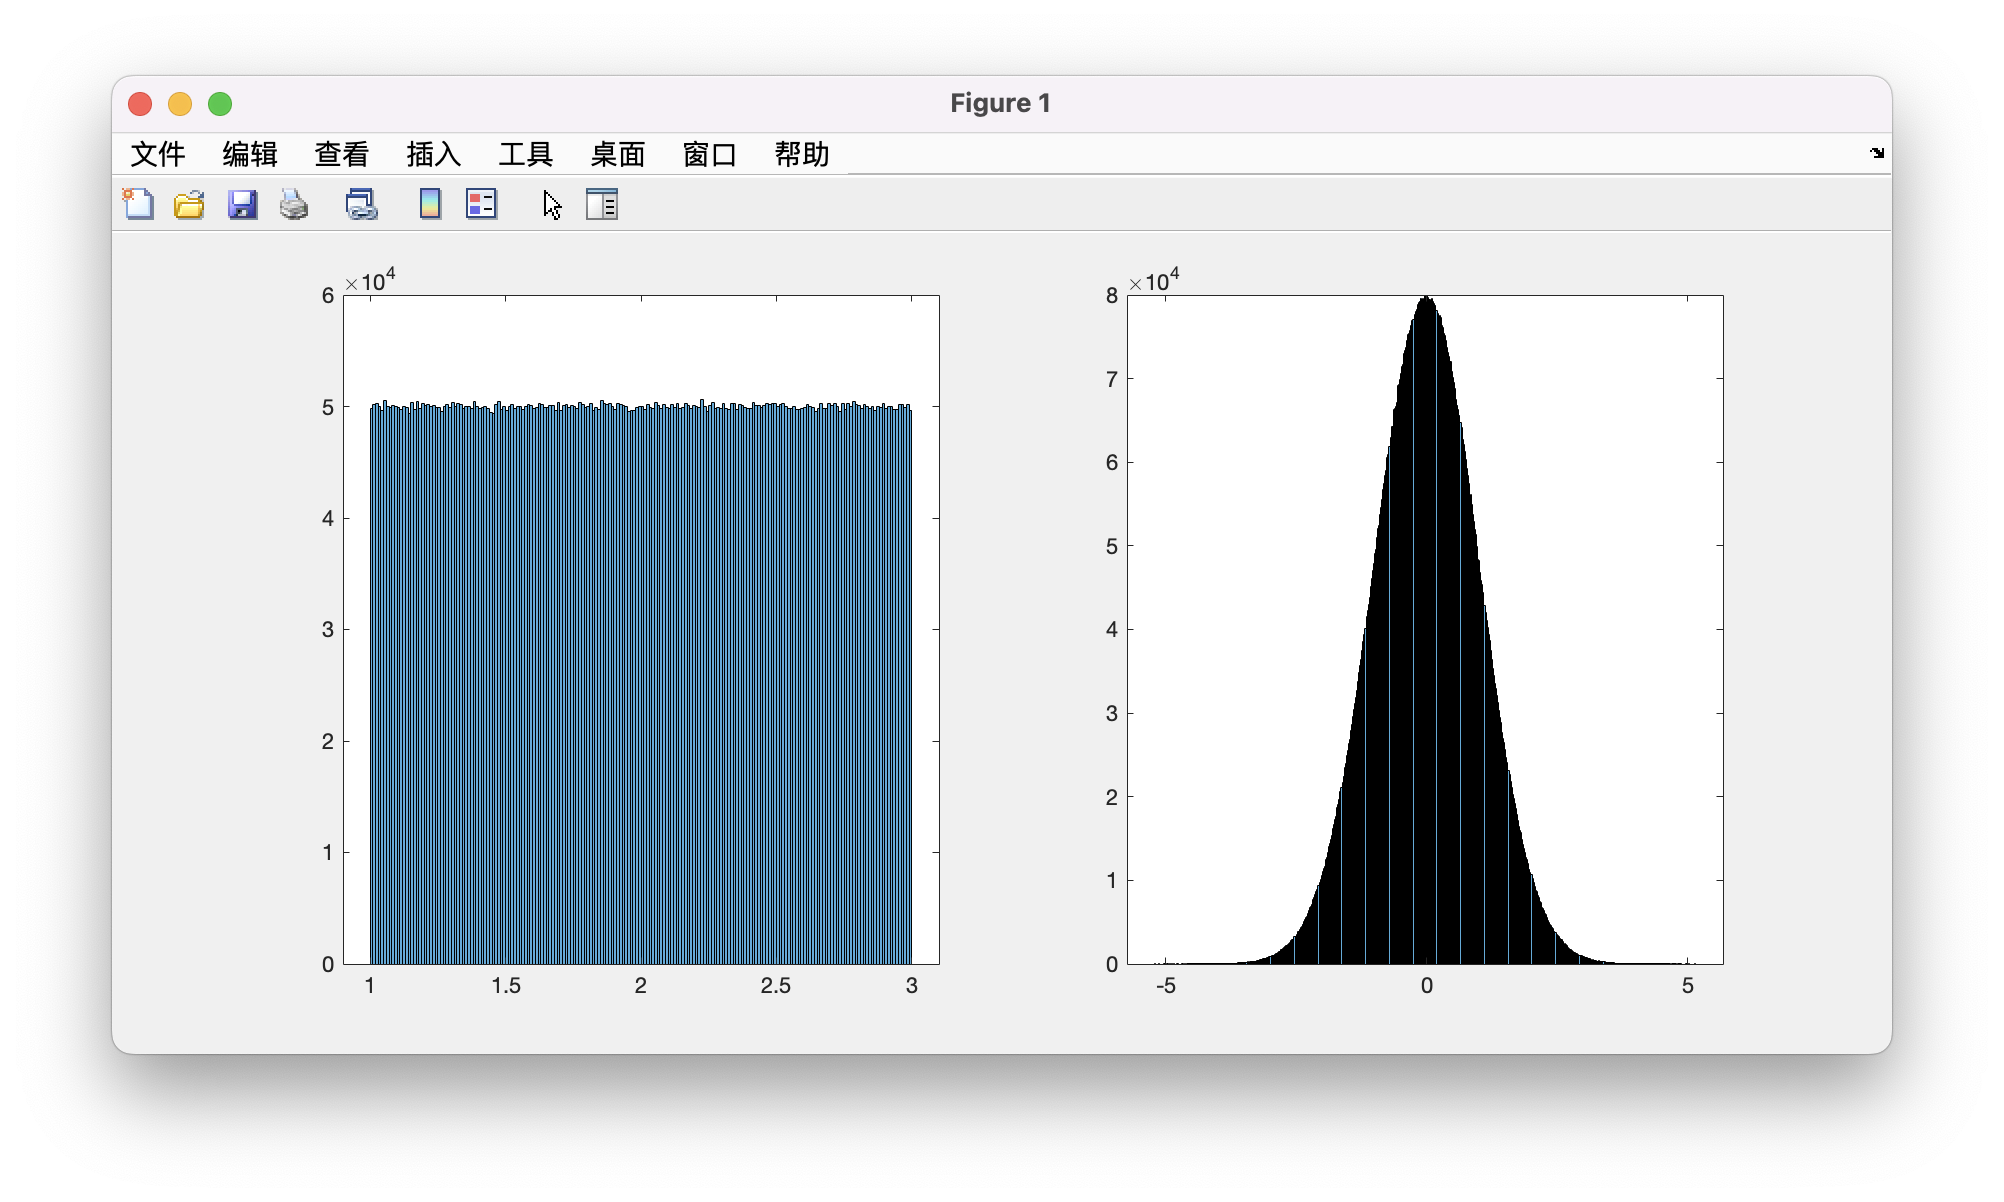
调用Matlab函数抽样
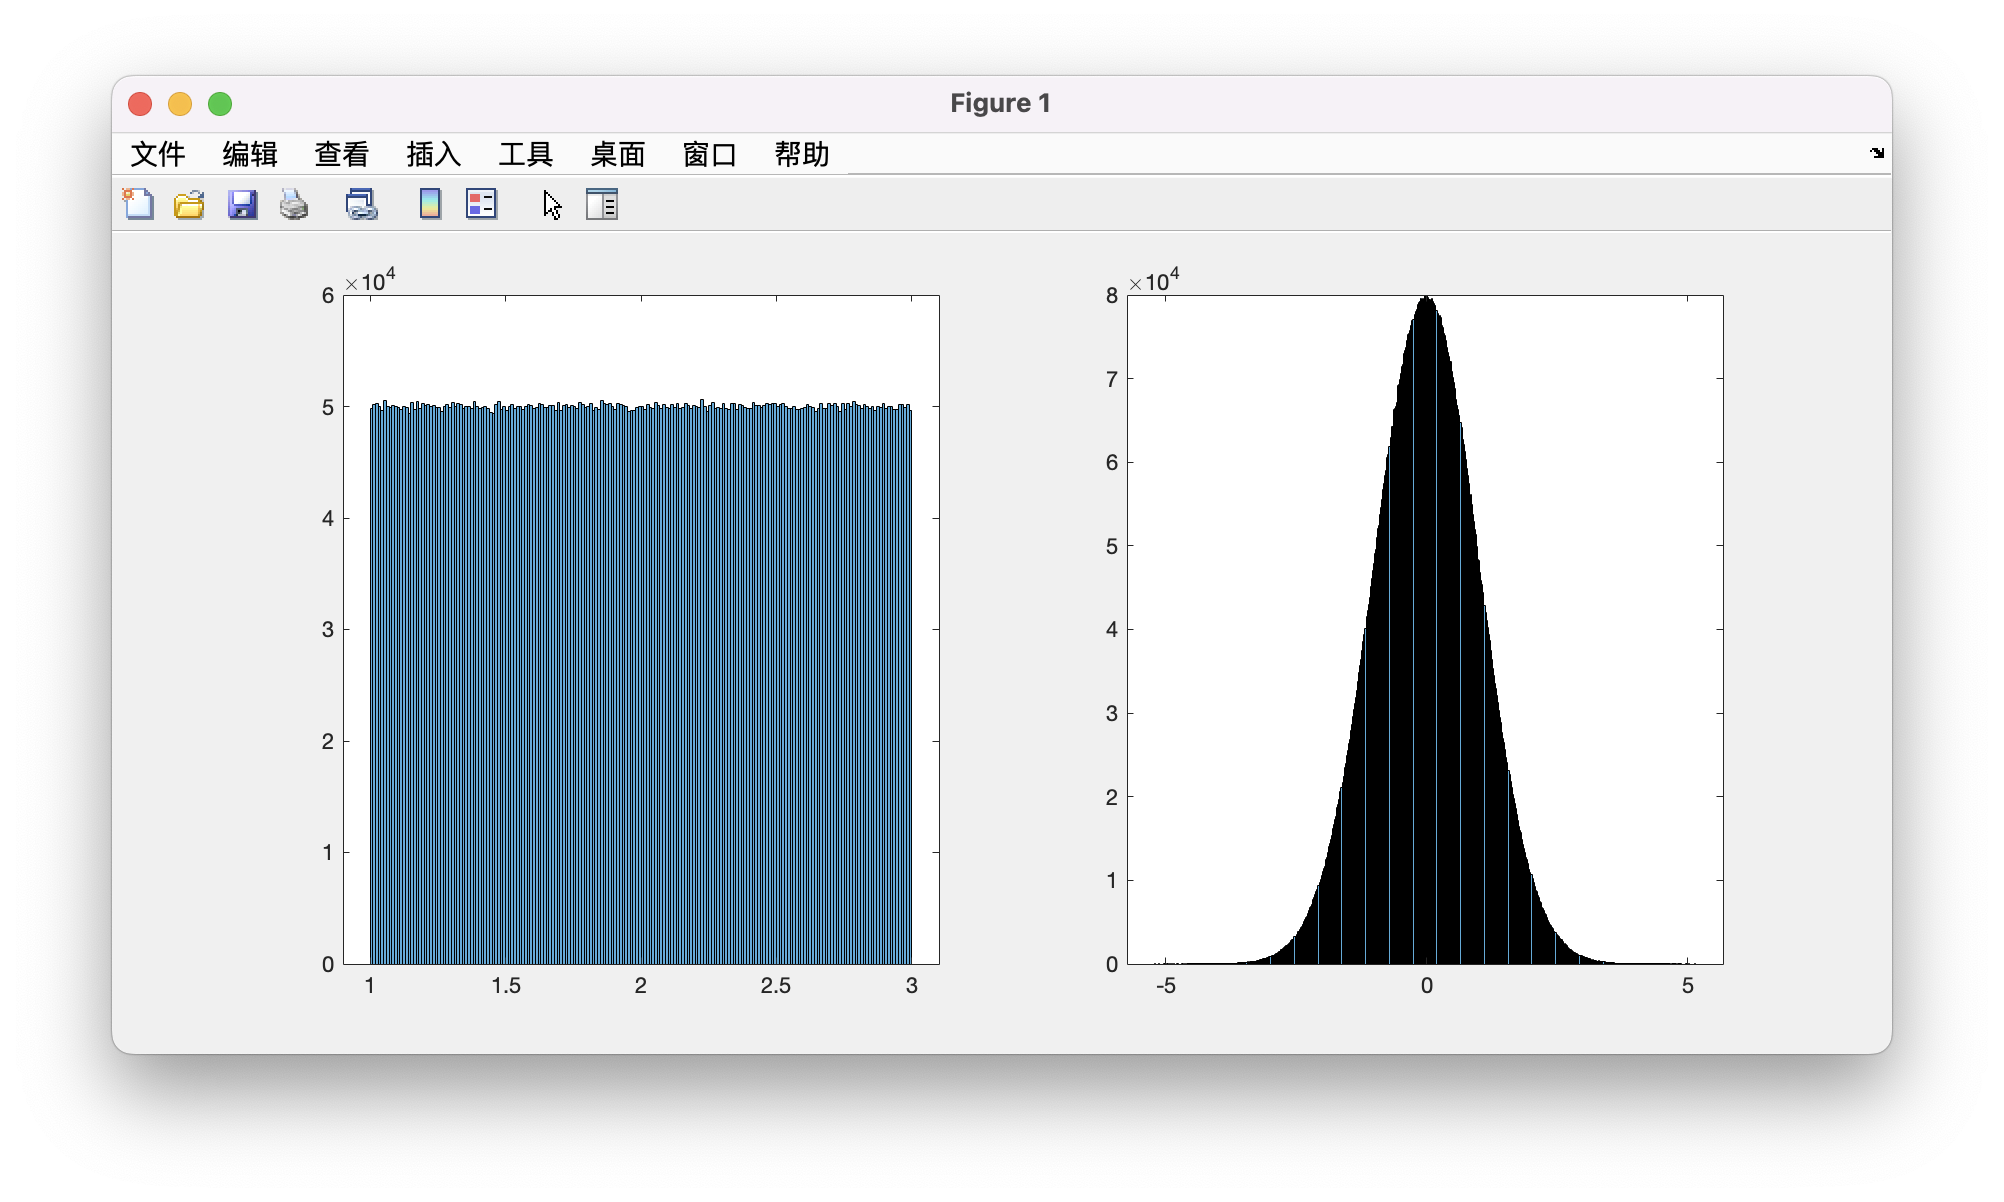
clc
clear
close all
%-----
a=1;b=3;
ns=1e7;
x=unifrnd(a,b,ns,1);
figure(1)
subplot(1,2,1)
histogram(x)

mux=0;sigx=1;
y=normrnd(mux,sigx,ns,1);
subplot(1,2,2)
histogram(y)
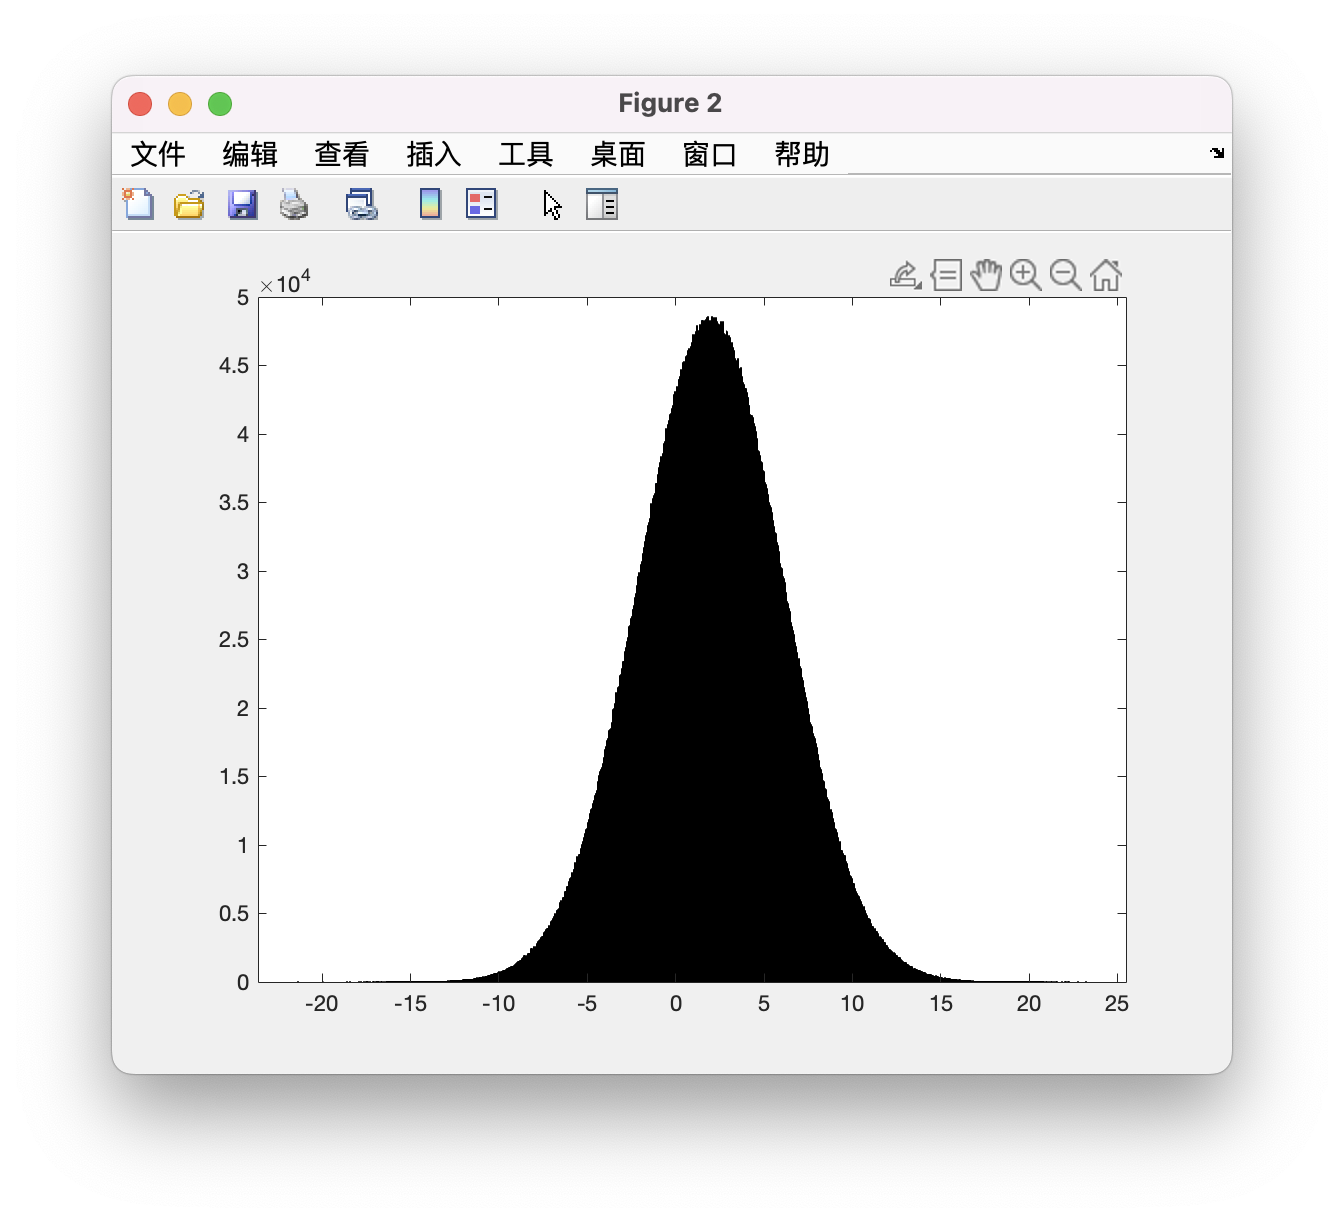
课程作业
clc
clear
close all
%-----
mux1=0;sigx1=1;
mux2=1;sigx2=2;
x=-5:0.1:7;
fx=normpdf(x,mux2,sigx2);
Fx=normcdf(x,mux2,sigx2);
h1=figure(1);
ax1=axes('Parent',h1,'Position',[0.2,0.55,0.6,0.35],'FontSize',10);
plot(x,fx,'r-')
xlabel('x2','FontSize',10)
ylabel('x2-pdf','FontSize',10)

ax2=axes('Parent',h1,'Position',[0.2,0.1,0.6,0.35],'FontSize',10);
plot(x,Fx,'r-')
xlabel('x2','FontSize',10)
ylabel('x2-cdf','FontSize',10)

ns=1e7;

y1=normrnd(mux1,sigx1,ns,1);
y2=normrnd(mux2,sigx2,ns,1);
y=y1+2*y2;
figure(2)
histogram(y)